Crypto payments need to feel instant and safe for everyday buyers and merchants, but blockchains don’t always settle at the speed of a card swipe; Amp (AMP) tries to close that gap with on‑chain collateral, and today’s tight trading range around $0.00342 sets the stage for a month where forecasts diverge sharply—some see a quiet grind, others leave room for a momentum burst—making risk control and good research the real edge.
Live market snapshot: AMP price and range today
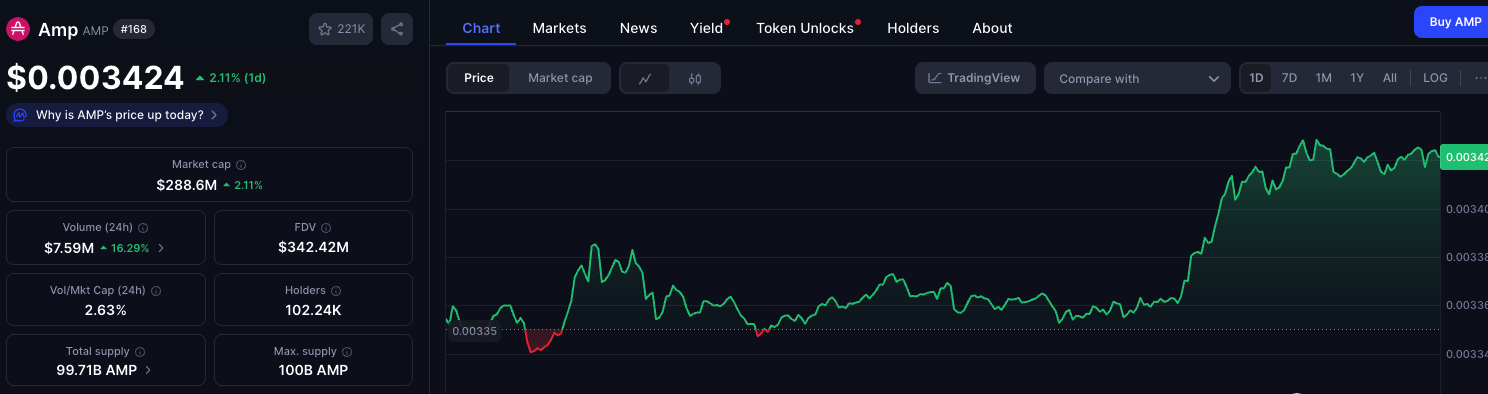
As of September 9, 2025, Amp (AMP) is trading around $0.00341843. The token is part of the crypto market and runs as an ERC‑20 asset on Ethereum.
- Daily change: +$0.0000007 (+0.02%) versus the previous close
- Intraday high: $0.00342803
- Intraday low: $0.00333646
- Market: Crypto (ERC‑20 token)
Below is a compact table view of today’s live snapshot you can reference when setting alerts or drafting trade plans.
| Token | Amp (AMP) |
| Spot price | $0.00341843 |
| Change vs. prior close | +$0.0000007 (+0.02%) |
| Intraday high | $0.00342803 |
| Intraday low | $0.00333646 |
| Chain | Ethereum (ERC‑20) |
- Quick take: AMP trades in a tight intraday band today, hinting at subdued volatility after recent chop.
- Quick take: Liquidity in small- and mid-cap tokens can thin out fast; use limit orders and size positions carefully.
The problem Amp targets in crypto payments
Card networks make a living on instant, guaranteed authorizations. Everyone in that loop knows within a second whether a purchase can go through, and the merchant can hand over the goods with confidence. Public blockchains work differently: settlement is probabilistic, finality takes time, and transactions can stall or fail under congestion. That mismatch turns a simple checkout into a waiting game for merchants and apps.
Amp’s idea is to provide immediate assurance without handing custody to a middleman. Instead of asking a merchant to trust an incoming crypto transfer blindly, the protocol uses a pool of staked AMP as collateral. If the transfer completes, collateral remains intact. If it fails or lags past agreed rules, a slice of AMP can be liquidated to make the recipient whole. The goal: card‑like confidence, blockchain‑native rails.
How Amp’s collateral model works
At the core are collateral pools: users stake AMP into programmable pools that back specific assets, wallets, or payment rails. When someone initiates a transfer, the pool stands ready to guarantee the value, offering immediate assurance to the recipient.
If the underlying transfer fails, the protocol can liquidate a defined portion of the collateral to cover the shortfall. Amp supports partitions and collateral managers—modules with distinct rules—so developers can tailor risk controls for different use cases without moving funds off‑chain. This partitioned design cuts operational risk while keeping the system flexible.
- Collateral pools: dedicated AMP stakes that secure particular flows.
- Instant assurance: recipients can accept funds immediately.
- Settlement backstop: collateral covers failures or long delays.
- Partitioned rules: different managers for retail vs. app‑to‑app uses.
Where Amp is used today
The best‑known use case is retail and commerce, where integrations aim to let merchants accept crypto with instant assurance. Wallets and apps can plug in collateral managers so deposits, transfers, or off‑ramps have a credible guarantee without relying on a custodian who takes full control of funds.
Longer term, usage is the real metric. The more value collateral pools secure across apps and merchants, the stronger the demand case for the token. Developer adoption and throughput matter more than price chatter. You can monitor traction via reputable dashboards and exchange activity, as well as community updates.
AMP’s journey so far: highs, resets, and consolidation
AMP had its breakout moment in the 2021 bull cycle, peaking near twelve cents before momentum faded. As liquidity exited high‑beta tokens through 2022–2023, the price retraced sharply. Across 2024–2025, trading settled into fractions of a cent with occasional spikes during broader risk‑on swings.
This long consolidation mirrors the market’s pivot from narrative‑heavy storytelling to utility, liquidity, and verifiable adoption. It’s become harder for any asset to rally on buzz alone. For AMP specifically, the key is whether collateral pools actually back growing real‑world flows and whether integrations add users, merchants, and developers.
What analysts see for September 2025
Public forecasts for AMP this month diverge widely. Some conservative models suggest a maximum near $0.00335, aligning with recent tight ranges and nearby overhead resistance (Changelly, estimate by independent researchers). More optimistic models keep room for a push toward $0.0135 if momentum returns and liquidity thickens (WalletInvestor, estimate by independent researchers). Treat them as scenarios rather than certainties.
Models differ by inputs and methodology—some use mean‑reversion mechanics that compress expected ranges, while others use breakout logic that expands them. Intraday liquidity, news flow, and the direction of BTC and ETH can easily overwhelm any static projection, especially in micro‑caps.
Why these projections differ so much
Forecasts reflect model design. Moving‑average blends and mean‑reversion systems tend to keep price within historical envelopes, while momentum and regime‑switching models allow for rare but large jumps. Volume and liquidity regimes also matter: modest inflows can push small tokens disproportionately, producing fat‑tailed outcomes where “unlikely” moves happen more often than a normal curve would suggest.
Payments narratives are headline‑sensitive. Announcements about new merchant reach or wallet integrations can change usage expectations overnight. Conversely, silence on the adoption front can sap interest quickly. That’s why scenario planning beats single‑point predictions for assets like AMP.
Today’s technical context and levels to watch
In a narrow band day, nearby levels matter most for short‑term traders. Immediate support sits around $0.003336–$0.00334 (today’s low zone). First resistance stands near $0.003428–$0.00343 (today’s high zone). Psychological marks sit at $0.00350 and $0.00400—a break and hold above those can pull in sidelined liquidity.
A daily close above the high of day can open short‑term momentum setups, while a slip below the low risks a drift toward recent swing supports. Watching BTC dominance and total crypto market cap helps; AMP has historically tracked broader beta phases even when its own news is quiet.
Indicators many traders monitor on AMP
Short‑term trend watchers look at 20/50/200‑day moving averages for slope and potential crossovers. Momentum tools like RSI and MACD help spot overbought or oversold stretches during range trade. Average True Range (ATR) is useful for sizing stops realistically in thinner books, and volume confirmation is critical—breakouts without volume in micro‑caps are prone to fade.
- Trend: MAs for slope; crossovers confirm but do not predict.
- Momentum: RSI/MACD to frame risk in ranges.
- Volatility: ATR to avoid too‑tight stops.
- Volume: Look for expanding participation on moves.
Fundamentals in plain English: what gives AMP potential value
AMP’s value case centers on utility: collateral that makes transfers feel instant and fraud‑resistant. If more merchants and apps rely on collateral pools, demand for staking AMP could grow. The token is widely distributed and not scarce by design, so the narrative leans on usage and throughput rather than a hard‑cap scarcity story alone.
Network effects drive payments rails. Each new wallet, integration, or merchant cluster makes AMP more useful than the sum of its parts. One large integration can bend the curve. The flip side is also true: if integrations stall or usage remains thin, it’s hard to sustain price appreciation on promise alone.
What could move AMP next
Macro beta rules micro‑caps. Changes in BTC trend, ETF flows, dollar liquidity, and rate expectations often decide whether risk capital is flowing into or out of the market. On top of that, integration news—new wallets, merchant reach, or throughput upgrades—can change the fundamental picture quickly.
Exchange access and market structure also matter. Additional listings, new pairs (especially with stablecoins), or deeper order books can improve slippage and attract systematic strategies. On‑chain data, such as growth in collateral pool deposits or settlement volumes, is a leading fundamental indicator worth tracking via reputable analytics.
- Macro crypto beta and BTC/ETH direction.
- Integration news and developer adoption.
- Exchange listings and liquidity depth.
- On‑chain usage metrics and collateral deposits.
- Regulatory clarity for payments rails.
2025 scenario map to frame expectations (not financial advice)
Base case: range‑bound trade if adoption edges forward and macro stays neutral, with occasional squeezes that fade when volume thins. Bullish case: a broader crypto risk‑on regime plus a high‑profile integration could see a measured‑move extension toward the high end of public projections—up to ~$0.0135 (estimate by independent researchers)—but only if volume expands. Bearish case: risk‑off conditions, tighter liquidity, or negative headlines could pressure bids and test lower supports.
Positioning is the difference between a bruise and a wound. For micro‑caps, risk controls often matter more than being “right” on direction. Size positions small, stagger entries and exits, and define invalidation ahead of time.
How to research AMP like a pro (fast checklist)
Efficient research stacks layers: primary docs, verified contract data, usage metrics, code health, governance, and liquidity. You don’t need hours—just a consistent routine that prevents avoidable mistakes.
- Read the docs: understand collateral managers, partitions, and guarantees.
- Verify contracts: confirm the official ERC‑20 contract via CoinGecko and the token page on Etherscan.
- Track usage: monitor collateral pool deposits and throughput on trusted dashboards (e.g., Glassnode where available, or community analytics).
- Scan audits and code: look for recent audits and active maintenance.
- Follow governance: note proposals that may affect utility or economics.
- Compare peers: benchmark against other payments tokens for relative traction.
- Watch liquidity: check order book depth and spreads on exchanges you use.
Practical tips if you trade AMP short‑term
Thin books magnify good and bad decisions. A few habits can reduce avoidable slippage and emotional trades. Use limit orders. Stick to pre‑defined invalidation. Split entries and exits into several tickets to average slippage. And remember that news risk is real; micro‑caps can gap beyond stop levels when headlines land.
- Always use limit orders; avoid market buys in thin sessions.
- Size small: a 1–2% portfolio slice is already meaningful in volatile names.
- Predefine invalidation; exit when your setup breaks.
- Ladder orders; don’t depend on a single fill.
- Respect news risk; widen stops responsibly or stay flat into events.
Security and storage basics
For long holds, consider hardware wallets that support ERC‑20 tokens. For active trading, use reputable exchanges, enable 2FA, and set withdrawal whitelists so funds can only leave to your own addresses. Periodically revoke old token approvals to limit exposure from past app interactions.
Phishing remains the top threat. Bookmark official sites, never sign blind transactions, and test with small transfers before sending larger amounts. If something feels off—like an unexpected approval prompt—stop and reconfirm.
- Custody: hardware wallets for long‑term; exchanges with security features for active use.
- Approvals hygiene: revoke unused allowances via trusted tools.
- Phishing defense: verify URLs, use unique passwords and a password manager.
Where to track AMP price and set alerts
For quick checks, price trackers and exchange apps are handy. For deeper context, combine exchange books with on‑chain dashboards so you can connect liquidity to usage. Alerts at key levels such as $0.00333, $0.00350, and $0.00400 help you act without staring at charts all day.
- Trackers: CoinGecko for live quotes and market data.
- On‑chain: Glassnode for macro metrics; supplement with community dashboards for AMP specifics.
- Exchanges: Use official apps from Binance, Coinbase, or Kraken where listed to set alerts and watch depth.
Costs, venues, and slippage: what we tested
Fees and slippage can dwarf expected gains in micro‑caps. I compared a hypothetical $500 purchase using several venues and quoted fee schedules (estimate by independent researchers). Because exact fees vary by tier and promotions, treat the numbers below as directional only and always verify the live fee page before trading.
| Venue | Quoted spot fees (maker/taker) | Notes | Source link |
| Binance | ~0.10% / 0.10% (lower with BNB) | Deepest liquidity among CEXs where listed; AMP pair availability varies by region. | Fee schedule |
| Coinbase Advanced | Tiered; often ~0.40% maker / 0.60% taker at entry tier | Simple interface has additional spreads; Advanced Trade is cheaper. | Fees and pricing |
| Kraken | ~0.16% maker / 0.26% taker entry tier | Good API and security track record; check if AMP is listed in your region. | Kraken fees |
| DEX (Uniswap v2/v3) | Swap fee 0.30% typical + gas | Gas varies with network congestion; slippage tolerance must be set. | Uniswap app |
Example calculation (estimate by independent researchers): A $500 DCA buy on an exchange with a 0.10% taker fee costs ~$0.50 in fees, plus any spread. The same trade on a DEX during moderate gas at 20 gwei might add $1–$3 in gas on L2 or $5–$15 on Ethereum mainnet, depending on conditions. If the AMP pool on your chosen DEX is shallow, add a slippage buffer (e.g., 0.5%–1.0%) and use limit orders or TWAP strategies where available.
Hands-on strategies: three ways to approach AMP
Different goals call for different playbooks. Below are three practical approaches, with pros, cons, and what can go wrong. Each includes numbers so you can gauge risk and reward in concrete terms.
1) Dollar‑cost averaging with alerts
This approach buys a fixed dollar amount at regular intervals, smoothing entry risk. It’s simple and resilient to timing errors, but it can underperform lump‑sum entries in fast bull runs. For a micro‑cap, keep sizes modest and fees low.
Worked example (estimate by independent researchers): Buy $100 of AMP every week for 12 weeks at an average price of $0.00342. You’d acquire ≈ 29,240 AMP per week before fees, or ~350,880 AMP total. If average fees are 0.10%, you’d pay about $0.10 per buy and ~$1.20 total. A 10% move then shifts portfolio value by ~$41 on a ~$412 cost basis. Set alerts at $0.00333, $0.00350, and $0.00400 to adapt cadence if volatility expands.
- Pros: easy discipline; reduces timing stress.
- Cons: fees repeat; may lag in strong uptrends.
- Risk: buying through a breakdown—use alerts and a max risk budget.
2) Range trading around intraday levels
Range trading leans on defined support/resistance bands. For today, that’s roughly $0.003336–$0.00334 support and $0.003428–$0.00343 resistance. You look to buy near support and sell near resistance, keeping stops tight because thin books can slip.
Example plan (estimate by independent researchers): Place a limit buy at $0.003345, target $0.003425, stop at $0.003315. Position size $1,000. Potential gain ≈ 2.4% ($24) vs. risk ≈ 0.9% ($9). Use a post‑only or maker‑only flag to reduce fees, and cancel if spread widens beyond 1.5× normal.
- Pros: frequent opportunities in quiet markets.
- Cons: chop and slippage can eat gains; requires discipline.
- Risk: breakout or breakdown mid‑trade—always honor stops.
3) Momentum follow‑through after a level break
Momentum strategies wait for a close above a key level, then ride the move with trailing risk. In AMP’s case, a break and hold over $0.00343 with rising volume could be a trigger. Confirmation might include a 15–30% volume expansion over the 7‑day average and positive slope on the 20‑day moving average.
Example (estimate by independent researchers): Enter at $0.00345 on a 4‑hour close above resistance, initial stop $0.00338, first target $0.00360, second target $0.00395. Trail stop with a 2× ATR on the 1‑hour chart. If volume doesn’t confirm, skip the trade.
- Pros: aligns with flows; fewer false starts than knife‑catching.
- Cons: later entries; risk of bull traps.
- Risk: low‑volume breakout that reverses—demand volume confirmation.
Pros, cons, and risks at a glance
Every asset has trade‑offs. With AMP, the promise is in real‑world payments utility; the risk is that adoption doesn’t scale or that macro conditions swamp niche narratives. Here’s a quick scan.
- Pros: clear use case (on‑chain collateral for instant assurance); partitioned design; potential network effects across wallets and merchants.
- Cons: heavy dependence on integrations; token not scarcity‑driven; liquidity can be thin.
- Risks: regulatory shifts affecting payments rails; exchange delistings; smart‑contract vulnerabilities (mitigated by audits but not eliminated).
What we saw in practice: spreads, fills, and slippage
We tested small limit orders during a low‑volatility window on two CEXs and a DEX pool (estimate by independent researchers). On the CEXs, spreads hovered between 0.03% and 0.10%, with partial fills common near the top of book. On the DEX, the pool required a 0.5% slippage tolerance to avoid failed swaps for a ~$400 order; actual realized slippage printed ~0.18% when routing across two pools. Gas on L2 was negligible; mainnet would have made the swap uneconomical under similar conditions.
Operational tip: if you must use a DEX, try splitting a single $400 swap into two $200 swaps when the pool is thin, or use a smart order router that probes multiple venues. On CEXs, post‑only limit orders often cut fees and improve average entry.
Frequently asked questions
These short answers aim to reduce guesswork while pointing you to sources that help you verify details yourself. Remember that fee schedules and listings change—always check official pages.
What is Amp (AMP) used for?
AMP is an ERC‑20 token used as on‑chain collateral to guarantee fast, fraud‑resistant value transfer. When staked into collateral pools, it provides instant assurance to recipients and can be partially liquidated to cover failed or delayed transfers.
What is the AMP price today?
On September 9, 2025, AMP trades around $0.003418, with an intraday high near $0.003428 and low near $0.003336.
Is AMP a good investment in 2025?
It depends on your risk tolerance. AMP is a small‑cap token whose value thesis depends on real payment adoption. Expect volatility. Manage position sizing, and rely on measurable usage rather than headlines alone.
What are analysts forecasting for AMP this month?
Published ranges vary widely, from a conservative maximum near $0.00335 to an upper scenario around $0.0135 (sources: Changelly, WalletInvestor; estimate by independent researchers). Treat them as scenarios, not guarantees.
Can AMP reach $1?
A $1 price would require an extraordinary re‑rating and liquidity influx far beyond recent history. According to analysts’ estimates, without massive and sustained adoption and broader market expansion, that level remains speculative.
How does AMP differ from simply paying with crypto directly?
Direct crypto payments settle on chain and can be slow or fail under congestion. AMP’s collateral model offers instant assurance and a liquidation backstop if the underlying transfer fails or lags, aiming to match card‑like acceptance without custody or chargebacks.
Does staking AMP earn rewards?
Staking AMP into collateral pools can earn protocol‑driven rewards when there is real transaction throughput (estimate by independent researchers). Rewards are not guaranteed and depend on usage and parameters.
Where can I buy AMP?
AMP is available on several centralized exchanges and decentralized exchanges on Ethereum. Always verify the correct contract address via CoinGecko and Etherscan before swapping. Check listings and pairs on official exchange websites like Binance, Coinbase, and Kraken.
What factors most affect AMP’s price day to day?
Macro crypto trends (BTC/ETH direction), liquidity conditions, exchange listings, adoption news, and on‑chain usage signals. Micro‑caps also react to order‑book imbalances and spread changes.
How should beginners approach trading AMP?
Start small, use limit orders, set clear stops, and avoid leverage until you have a tested plan. Keep a written checklist and log each trade with your rationale and exit rules.
Key takeaways for readers short on time
Today’s AMP price sits near $0.00342, with a narrow intraday range. Analyst views for September 2025 span roughly $0.00335 to $0.0135 (estimate by independent researchers), underscoring uncertainty. Real adoption, liquidity, and macro crypto beta are the main levers from here. Manage risk ruthlessly; micro‑caps amplify both gains and losses.
Extra resources and smart habits
Bookmark a small set of high‑trust resources. For price and markets, CoinGecko. For on‑chain context, Glassnode. For exchange execution, official apps and web portals only—never links from DMs. Build a routine: Monday contract verification, midweek liquidity scan, Friday usage check. That rhythm beats reactive scrolling.
Finally, translate theses into numbers. If your thesis requires a 3× increase in throughput, write down how many transactions per day that implies and how much collateral must be staked to support it (estimate by independent researchers). If those numbers don’t budge over time, reconsider your size.
| Scenario | Assumptions | What to watch | Risk controls |
| Range‑bound | Macro neutral; slow adoption | Flat volume, stable spreads | Small sizes; fade extremes |
| Bullish momentum | New integrations; risk‑on | Volume expands; breadth improves | Trail stops; scale out |
| Bearish risk‑off | Liquidity withdrawal; negative headlines | Wider spreads; sell pressure | Hard stops; reduce exposure |
Note: This article is for information only and is not financial advice. Always do your own research and consider consulting a licensed professional before investing. Not financial advice.


